|
|
|
|
SRE at Agilent Technologies, Colorado Springs
By Tim Chambers, Agilent Technologies, Digital Design Products
11 October 2000
http://alum.mit.edu/www/tbc/hacks/issre2k.htm
Copyright © 2000 Agilent Technologies
Abstract
I discuss experiences with SRE by three teams working for Agilent Technologies in Colorado Springs. After setting the scene with a brief explanation of the teams and a history of our adoption of SRE, I explain how we now use it. I cite some specific processes and techniques, comparing them to the formal methods taught by John Musa in his book Software Reliability Engineering. For each process and technique, I present data that demonstrates improvements to software quality, and I show how those improvements are a direct result of our use of SRE principles.
About Our Organization
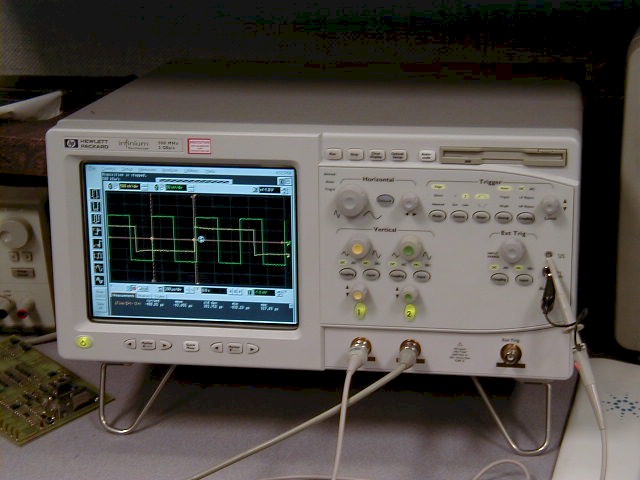
This paper discusses work performed by three Agilent Technologies teams who design and manufacture instruments and systems primarily used by digital design engineers. Our products have included oscilloscopes, logic analyzers, and microprocessor development systems (emulators). Our work with SRE spans over a decade, during which some organizational changes have occurred. The most drastic change was our recent spin-off from Hewlett-Packard Company to become the new, independent company Agilent Technologies. Our product lines have remained the same, though. The Agilent Infinium oscilloscope, the Agilent 16702B Logic Analysis System, and the HP 64700 Microprocessor Development System (emulator) are show below.
|
|
|
|
Our software development environments span a wide range of conditions -- from minicomputer applications to embedded firmware. Our emulator software runs as an application on UNIX workstations. The interfaces of some oscilloscope products run as applications under Microsoft Windows 95, where Windows is embedded in the instrument. Our logic analyzer product line includes a system that runs UNIX in a closed environment; i.e. the user sees a self-contained graphical interface and has no access to the native operating system. Other logic analyzers and oscilloscopes are embedded systems that run small, real-time operating systems. We are also beginning to develop Microsoft additional Windows applications, some of which will run as standalone applications on a PC. Practically all of our software is written in either C or C++.
It's important to share stories about how ideas spread through organizations. By sharing stories of what worked and what didn't, we all can learn how to improve the adoption of new, useful ideas.
Agilent in Colorado Springs began applying SRE in the late 1980's. At that time the emulator team relocated several miles from the "mother" campus, so we were isolated. [LESSON: beware the effects of isolation on process adoption.] I had the role of engineering productivity manager for that team. My department also provided engineering services, including printed circuit board layout. One software process engineer (Jim Jost, a statistician by training) and I were attempting to influence the strategic direction of the software development process. [LESSON: it only takes one individual and a manager who supports the idea.] We served about 80 product development engineers -- slightly less hardware than software (which includes firmware).
Earlier in the decade we were bitten by a software product line that had not been developed with reliability engineering in mind. After the products had been out for a while, the customer complaints drove us to assign a large team (around a dozen) to repair the backlog of defects. We called it the Bugbusters project. Jim worked with new product development teams to learn what could be done to avoid another Bugbusters fiasco. [LESSON: if you want a different result, you have to do something differently.]
Thanks to Bugbusters, for the first time we were regularly monitoring the trends in software defect repair. That isn't to say that our quality department hadn't been tracking customer-reported defects before, but Bugbusters put the data on the front page of the division manager's newspaper and kept it there, so to speak.
In addition to Bugbusters, the CEO of HP challenged the company to improve the quality of HP software by a factor of 10. We had always tracked the number of unfixed defects over time; but this was also the period where we began developing a formal, data-driven testing process before software product release [note 1]. Our process improvement methods focused on the goal of driving the software toward release. We started enforcing release criteria for our software products. Our software QA manager argued for the value of finding system failures ourselves before our customers found them for us. We began tracking pre-release testing effort. We agreed on a standard method for measuring time spent testing, and we enforced requirements on minimum times to be met. We committed to a standard method for counting source statements, and we derived the defect densities of our products both before they were released and afterward. Early on, we agreed that a defect rate of 0.2 was our release goal, and that has not changed since. (See the section on "Adjusting the moving average to smooth the defect rate" for more about defect rates.) We agreed on the defect severity classification shown in Table 1. The wording has varied only slightly, and we have found the "bullet-item" descriptions to be sufficient.
Processes and Techniques
An organization's culture impacts its implementation of software quality methods. [LESSON: recognize the impact of culture on implementation of SRE.] In the Agilent culture (inherited from HP), we expect engineers to develop one product end-to-end and then to move on to a new project. We don't have a high level of services that some R&D labs employ, such as technicians who offload routine tasks from the design engineers. Our software engineers almost always design and run their own tests in addition to their primary task, which is to design and implement products. Not many test procedures are written down for technicians or temp agency testers to follow. We encourage the creation of test plans, but they are typically written in generalities that assume an engineer who is familiar with the product will derive the details of the test procedure.
These are the most significant processes and techniques we have in place to ensure the quality of our software.
One common principle applied in all six of these topics is summed up in one word: pragmatism. In the following sections I discuss each of these topics in more detail, including both how our culture influences our implementation and how we apply pragmatism.
Applying the "Black Team" principle
Tom DeMarco's colorful account of the original, "legendary" Black Team at IBM can be found in [TD82] pp. 221-222. For the dry purposes of this paper, it suffices to say that a Black Team's top motivation is the discovery of defects, while a code developer's top motivation is the correct behavior of the code. It's a subtle difference -- programmers righteously resent the implication that they don't try hard to uncover defects in their code before they release it. However, most programmers will also admit that at some point defect detection becomes more efficient when someone other than the developer tests the software. As Eric S. Raymond observed, "Given enough eyeballs, all bugs are shallow." [note 2]
We always accepted the principle of the Black Team, but we had to adapt our culture to take full advantage of it. Our culture frowns on a separate test team, but it encourages temporarily increasing staff to accelerate progress. In this specialized case, Brooks' Law [note 3] doesn't apply: staffing up projects at the end to perform tests in parallel does indeed get our products to market faster. Early in our work on SRE, we found that we could recruit engineers from other projects to help with testing. But the dynamics have been extremely sensitive at times. Managers were reluctant to release engineers from their primary projects -- even for only 4 to 8 hours. Engineers also sometimes resisted the mental "context switch" required between their singular project and the test plans for other product features. As our track record with SRE grew, though, it became easier to convince both managers and engineers of the value of sharing the test load. At last, a decade later, we have internalized this staffing technique to the level of policy [note 4] -- we have strong support at all levels of management to staff test efforts adequately.
Such policies are enforced by our manager of Software Process Improvement and Testing, John Rasper. He works with the other project managers in the lab to schedule their engineers' testing time commitment. In fact, John also recruits project managers and the marketing staff as testers. John works with the logic analyzer/emulator team. Mark Lambuth fills the same role for the oscilloscope team. We have all bought into the benefit of part-time Black Team testers. The time commitment varies. For individuals, 4 to 8 hours per release is common, but so is 2 to 4 hours a week until the product is released. We budget anywhere from 350 to 2,000 hours of test time, depending on the magnitude of the product release.
Our test strategy is not as formal as one that employs Musa's Operational Profiles [JM99]. We use heuristics to identify regions of the code that have the greatest risk of affecting product quality. The heuristics are based on two key concerns:
The test manager assigns each tester to target one or more specific features. We have a dedicated test area stocked with systems running copies of our "golden bits." [note 5] The testers are expected to sign up for time on the systems in the test area and to try to uncover defects in the product. Instead of calling them a Black Team, we use the term "abuse testers." They test permutations of feature options, look for boundary conditions, configure the system at the limits of specifications (e.g. loading a system with the maximum set of cards), and try anything else that they believe may uncover a defect that a customer would otherwise encounter.
We've also seen unexpected benefits by recruiting testers from other projects. There's a greater sense of camaraderie in the lab. Project teams hold one another to "fairness" -- "we tested for you, now it's your turn to do it for us." While they're testing, engineers get a much broader understanding of how customers use our products; and ideas about better ways to serve our customers get "cross-fertilized" among project teams. Like IBM's Black Team, our recruits are motivated to find bugs. Gifted testers develop a reputation for uncovering tenebrous problems, and they are sought out for the next test cycle to repeat their feats. Their names are spoken with awe and reverence. We motivate testers by putting snack foods in the test area. We thank testers with certificates for free cappuccino (and sometimes even certificates for free dinners). We reward everyone who tests for a minimum number of hours with an invitation to attend a group activity -- we all carpool to the local theater to watch a movie together. The "QA movie," like abuse testing itself, has become elevated to the status of unwritten policy. [note 6] Testing has almost become fun around here!
We track time spent testing the product to the nearest half-hour. Every activity that can be traced to the effort required to test the product is counted in this time. For example, all of these are understood to be testing activities counted in test time metrics:
This convention has been in use for over a decade. We chose this relaxed definition of test time to simplify the judgment needed to collection of test time. We wanted to maximize compliance from engineers reporting the data. Partly, this was a compromise to eliminate cavils about what to count. It has also proven effective in obtaining buy-in from managers who want to know exactly how much time they are signing their engineers up for.
As I said in the History section, our wording of defect classifications has varied only slightly since it was written down over a decade ago, and we have found the "bullet-item" descriptions to be sufficient for classifying all our software defects. Testers accurately classify severity, but occasionally they are overruled -- sometimes higher and sometimes lower. Table 1 documents our entire policy for defect classification and weighting. The graphs don't show much of a difference between the weighted and non-weighted data, but note in Figure 3 (the weighted version) that we cross the release goal line at 742 hours, and in Figure 4 (the non-weighted version) we cross it at 711 hours. This isn't a drastic difference; however, weighting the defects by severity helps eliminate objections to managers' concerns that we don't "care" enough about critical defects when compared with defects of the lowest severity. We respond to this objection by pointing out that our weighting system values a critical defect at nine times over the impact of a low-severity defect.
Critical (weight = 1.8)
|
Serious (weight = 1.4)
|
Medium (weight = 0.8)
|
Low (weight = 0.2)
|
Table 1: defect severity classes
Adjusting the moving average to smooth the defect rate
At Agilent Technologies, we measure the defect rate of our software. It is similar to failure intensity, but while Musa defines failure intensity as "the derivative of the mean value function with respect to time[,]... an instantaneous value," [note 7] we define the defect rate to be a moving average [note 8] with respect to a specified period of time. For over a decade we have experimented with what that period of time should be. We've used rates of between 20 and 50 percent of the total test time. For instance, on one project with 180 hours of abuse test time, we used a 40-hour moving average; on another project with just over 2,000 hours of test time, we measured the rate for a 1,100-hour moving average. We also begin with a smaller period (e.g. 10 hours) to get data early in the test cycle. Figure 1, Figure 2, and Figure 3 show the difference for one project using 25, 50, and 100-hour moving averages.
Because the smoothing resulting from different periods for the moving average is proportional to the size of the period, we use a larger number if we want a more "conservative" perspective on the quality of the software. Notice in Figure 1 that we temporarily dropped below our release goal between 440 and 494 hours of testing. Figure 2 shows a smaller dip at 480 hours, and Figure 3 shows no dip at all in that timeframe. We often plot with different periods to convince ourselves that the rate is safe to accept. We may want to be conservative because a product is expensive to upgrade in the field, or because we need to make an especially good impression with a product. We may not be so conservative if we are testing an interim release for which mistakes can be corrected in the next release.
As was mentioned in the History section, our release goal is a rate of 0.2 defects found per time period specified by the moving average. Originally, we chose 0.1 based on the literature in the late 1980's [note 9]. Our experience later convinced us that 0.2 was sufficient, and we've kept it because we're satisfied with the results it gives us.
Figure 1: defect rate, 25-hour moving average
Figure 2: defect rate, 50-hour moving average
Figure 3: defect rate, 100-hour moving average
Figure 4: defect rate, 100-hour moving average, non-weighted
Figure 5 and Figure 6 demonstrate two other techniques we use to manage our software test process.
Figure 5 shows a calculation of upper and lower bounds for the defect rate. We use this to track our progress during the chaotic time in the test cycle when defects are being characterized, fixed, and closed at the same time that new (and hopefully better) versions of the software are released to the testers. The lower bound indicates a rate based only on defects already closed as "Code Change" or "Won't Fix." [note 10] The upper bound assumes that all open defects are legitimate. In our experience, this has never been the case. Some defects are found to be duplicates of issues already submitted, others are "pilot error" or cannot be reproduced. The solid blue line in the graph is our best estimate of the defect rate. The points on this line are calculated by taking a percentage of the distance between the lower and upper bounds. The graph shown sets this parameter to 59%.
While we use Figure 5 to estimate our progress, Figure 6 proactively helps us balance resources between finding new defects and fixing those that already have been found. It's a straightforward metric. Whenever the solid green line creeps too far away from the broken red line, we slow down or cease our testing effort while the development team catches up with repairs. When we first started measuring this phenomenon, we ceased testing altogether. We then learned that we didn't have to do that. We use a more active feedback system to keep some testers busy while we slowly close the gap. Mark Lambuth aptly calls this a "rheostat" in the test system. It takes advantage of queuing theory to optimize throughput. When we notice that defects have a higher in a particular set of features, we suspend testing on those features while the team fixed the code, and we concentrate on testing other features.
Figure 6: find and fix rate
Counting source statements to measure defect density
Table 2 reveals our organization's results in terms of defect density. According to [MD92], p. 22, the Cleanroom approach yields some of the best process results in the industry: between 0 and 1 defects per thousand lines of code (KLOC). We make a synonymous measure -- thousands of non-commented source statements (KNCSS) -- and our data demonstrates that we are achieving defect densities well within the realm of Cleanroom outcomes.
The pragmatic measure we use to reassure ourselves that we are on the right track is that we are delighting our customers. We receive relatively few support calls, and our calls are weighted more toward enhancement requests. In the past, we have had to address system lockups and backlogs of customer-reported defects. (No more Bugbusters projects!) A competitor of ours used to show our product locking up in order to sell against us. We no longer hear such reports from the field.
| Project |
KNCSS |
Pre- release Defect Density |
Post- release Defect Density |
| A |
1,637 |
0.252 |
0.015 |
| C |
60 |
2.267 |
0.000 |
| D |
98 |
1.143 |
0.010 |
| E |
96 |
8.562 |
0.333 |
| F |
446 |
3.303 |
0.157 |
| G |
123 |
10.859 |
0.016 |
Table 2: product defect densities before and after release
Measuring how a software system changes over time (turmoil)
We define turmoil to be a measure of code stability. We calculate the turmoil of a release for the first time by identifying all source files at a point in time early in the development cycle. For subsequent data points, each file is compared against the previous version, and the number of non-commented source statements (NCSS) added, deleted, and changed is counted. The number of NCSS changed is then doubled. The rationale is that a changed line can be represented by the transformation: delete the old line, add the new one.
We measure two types of turmoil over time. For snapshot turmoil, the differences are always measured against the baseline version. Incremental turmoil is measured by comparing the newer version against the version used for the previous turmoil measure.
Figure 7: snapshot turmoil
Snapshot turmoil (Figure 7) measures the accumulated turmoil since the release diverged from the baseline and plots the trend over time. It is useful for helping to determine the amount of testing effort needed. Presently, we use this data in a heuristic process to estimate testing effort. We intend someday to develop a model that is more rigorous, though.
Incremental turmoil (Figure 8) is a differential between the times plotted. It is useful for measuring the stability of the code and for tracking progress toward closure. We always see a pattern of a very large number of initial changes followed by some oscillation between periods of large and small changes. We don't expect the entire product to be ready for testing at once, and incremental turmoil reflects the arrival of features over time as they are sequenced into the release according to our plans.
The graph in Figure 9 is our way of "zooming in" on the most recent activity. In our experience, incremental turmoil never falls completely to zero. When activity slows into the hundreds of lines changed, we become confident that the code is nearly stable enough to release. At that time, we "lock down" the source code and restrict changes to engineers who apply for "tickets" with managers. This has proven to be very effective in enforcement of release deadlines.
Figure 8: incremental turmoil
Figure 9: incremental turmoil, last three publishes
One Other Technique
In addition to the SRE methods described in this paper, we also attribute our success to a controlled software development process that focuses on three levels of integration. First, developers work in isolation from each other in their own developer workspaces. Then they publish their code to a feature integration workspace, where their changes are tested with others working on the same feature. Sometimes only one engineer works on a feature; then this is a trivial step. But sometimes we have a whole squad [note 11] of engineers integrating a very complex feature. They work together to ensure that their feature works. Finally, we use a release integration workspace to integrate the entire product release comprised of several features. The detailed operation of our entire software development process is the subject of a different paper yet to be written.
Conclusion
I have introduced the reader to the context of our decade-long practice of software development and have proceeded to discuss the most significant SRE processes and techniques that we use to ensure the quality of our software.
This paper does not claim to be an academic study; rather, it has presented samples of actual data that we are using to run our business. I have demonstrated that our pragmatic approach -- far less rigorous than models such as Musa's SRE [JM99] and Dyer's Cleanroom [MD92] -- achieves remarkable, measurable results.
About the Author
Tim Chambers was with Hewlett-Packard Company (HP) for fifteen years. Since June 2000 he has been with HP's spin-off, Agilent Technologies in Colorado Springs, Colorado. Tim's career at HP/Agilent includes management of one division's software product development process, various assignments developing software, and eighteen months in marketing.
Tim has been a software process engineer for the past three years in the Agilent business unit responsible for logic analyzers, microprocessor debug, and emulation. His work is centered on tools for the software development process, especially software configuration management.
He can be reached at issre2k@timchambersusa.com.
Copyright Information
This paper is Copyright © 2000 Agilent Technologies. However, you are encouraged to download, forward, copy, print, or distribute it, provided you do so in its entirety (including this notice) and do not sell or otherwise exploit it for commercial purposes.
This paper is available on the World Wide Web at http://alum.mit.edu/www/tbc/hacks/issre2k.htm, both in PDF and HTML formats.
Bibliography
[JM99] Musa, John D. 1999. Software Reliability Engineering. New York: McGraw Hill.
[TD82] DeMarco, Tom 1982. Controlling Software Projects. New York: Yourdon Press.
[FB95] Brooks, Frederick P., Jr. 1995. The Mythical Man-Month, Anniversary Edition. Reading, Massachusetts: Addison-Wesley Publishing Co.
[ESR99] Raymond, Eric S. 1999. The Cathedral and the Bazaar: Musings on Linux and Open Source by an Accidental Revolutionary. Sebastopol, California: O'Reilly & Associates.
[MD92] Dyer, Michael 1992. The Cleanroom Approach to Quality Software Development. New York: John Wiley & Sons.
[KGO59] Kurnow, Ernest; Glasser, Gerald J.; and Ottman, Frederick R. 1959. Statistics for Business Decisions. Homewood, Illinois: Richard D. Irwin, Inc.
End Notes
1 This work was done in isolation of other SRE research being done in the industry at-large during that time. [back]
2 Raymond credits Linus Torvalds with the inspiration for this quotation, which he dubs "Linus' Law." The "mainstream" source for the quotation is [ESR99], but http://www.tuxedo.org/~esr/writings/cathedral-bazaar/cathedral-bazaar/x147.html archives the earliest source (1997), originally distributed freely on the Internet. [back]
3 Brooks' Law: "Adding manpower to a late software project makes it later." See [FB95]. [back]
4 Not that Agilent or HP culture has ever been one that encouraged writing a thick policy manual. Our "policy" of recruiting engineers to help test products before release is de facto. [back]
5 Every organization has its own version of "golden bits." The term is a nickname for the best version of the software at any given time. We build our software products in a tightly controlled environment -- sometimes we build the system more than once a day. Our configuration and build management system contributes greatly to our organization's success, but its operation is beyond the scope of this paper. [back]
6 That is, we all take it for granted that after a release there will be a QA movie, and the questions of when it's going be and which movie we should see are routinely asked around the break stands after release. [back]
8 We are aware of the Slutsky-Yule effect: in moving averages on data that is relatively constant except for occasional random events, the random event appears to be a cyclical fluctuation. [KGO59], pp. 469-470. It doesn't trouble our particular process, though. We suppose that the randomness inherent in the process of finding defects in software overshadows Slutsky-Yule. [back]
9 Regrettably, we no longer have a record of which literature we consulted. [back]
10 We do document "Won't Fix" issues with workarounds so our customers' expectations are set correctly. [back]
11 The word "squad" was deliberately chosen for its military shades of meaning -- the basic tactical unit whose size varies "greatly" but is usually in the range of 4 to12. See http://www.fas.org/man/dod-101/army/unit/squad.htm. [back]