![]()
(1)
HITRAN Line strength is closely related to the cross section of a photon interacting with a molecule.
The HITRAN unit of line strength of cm-1/(molecules cm-2) is basically the integral of the absorbance over one line:
|
|
(1) |
CD is the concentration distance product in units of molecules/cm2, k is the wavenumber (spatial frequency) in units of cm-1. It's easy to calculate the absorption over a bandwidth Dk that is wider than the linewidth. Let g be the half-width at half maximum (HWHM) of the spectral line.
|
|
(2) |
In 2 we assume that incoming radiation is spectrally uniform over a bandwidth Dk. The fraction 2g/Dk is the chunk that is attenuated in accordance with Beers law.
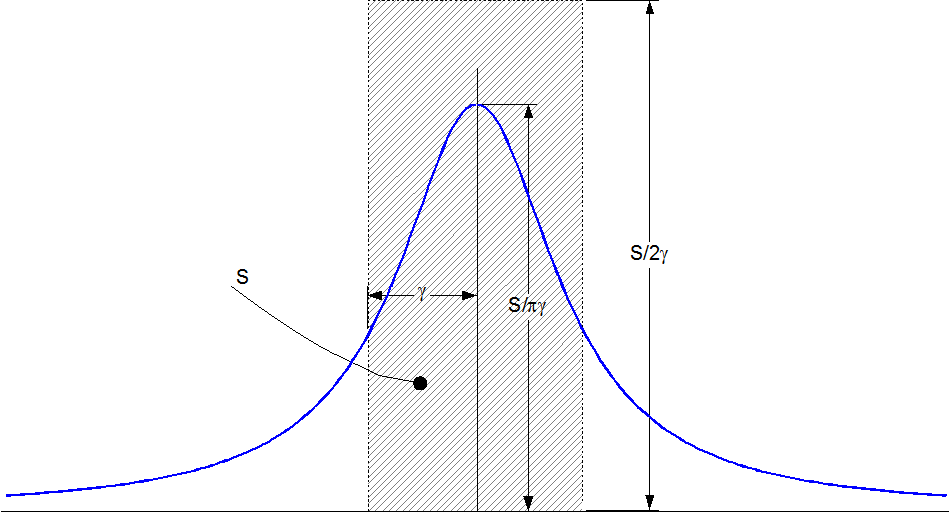
The area of the hatched region in the figure equals the area under the Line shape curve--that area is the HITRAN line intensity value.
To calculate the absorbance over a region that is narrower than the line itself, we need the line shape function. The usual line shape is the Lorentz function:
|
|
(3) |
Note that L has units of cm (or 1/cm-1 if you prefer) The product of the Lorentz line shape with the HITRAN value of S gives you the molecular cross section for absorption at a given wave-number. It's often more convenient to use the molar cross section, so multiply by Avogadro s number NA
|
|
(4) |
Typical units of Kr would be cm2/mole
HITRAN provides two values of g:the air broadened value suitable for CO2 in the Earth's atmosphere for example, and the self broadened value, appropriate for pure or nearly pure samples--CO2 on Mars for example.
Lines tend to group into bands comprising thousands of lines. Because of the slow decay of the Lorentz function it is necessary to sum the contribution of every line in the band to ensure an accurate calculation. Also because of the peakiness of the spectrum it is desirable to integrate the absorbance over each wavenumber value. The indefinite integral of L in eq 3 is simply:
|
|
(5) |
So given a bunch of HITRAN line strengths Sk at wave numbers kk together with width parameters gk ,the following formula will calculate the cross section per molecule Km over a band Dk centered about k:
|
|
(6) |
For example, we will calculate a table of Km using eq 6 with k ranging from 650cm to 800 cm-1 in steps of .06 cm-1 that's about 4000 data points. The HITRAN data base provides a little over 24,000 lines for the main C12 isotope alone. The accompanying FORTRAN program will compute the table. To use this program,(assuming you have a FORTRAN compiler and know how to use it), go to the HITRAN web site and download the HAWKS program. After you have figured out how to use HAWKS, download the CO2 data or whatever else interests you into a text file (don't use comma separated format it is awkward to read CSV data into FORTRAN).
Each line of data starts out with:
[Mol,isotope,wavenumber, S,Transition Moment, air width,self width,.....]
The format of each line :
[I2,I1,F12.6,E10.3,E10.3,F5.4,F5.4,...]
The program reads the first two integers,into unused varaibles, loads the next 5 floats into the array VAL, and ignores the rest of the line. (Transition moment is also unused by the program)
After reading the data things go smooth and fast. Nothing beats FORTRAN for sheer number crunching. The program as written computes over 4000 table values from over 22000 HITRAN lines in less than a minute on a 1.5 GHz laptop. Each ouput line is the wavenumber in cm-1 followed by the absorption cross section in units of cm2/molecule. The program as written outputs comma separated value format (CSV)and is readable by Excel, OoCalc,Mathcad etc.(For gnuplot you may want to use a TAB separated .dat file). To compare the values with absorbance such as used by EPA, which uses base 10 log of the extinction ratio over a 1 meter distance at concentration 7.5 ppmv multiply each line by:
|
|
(7) |
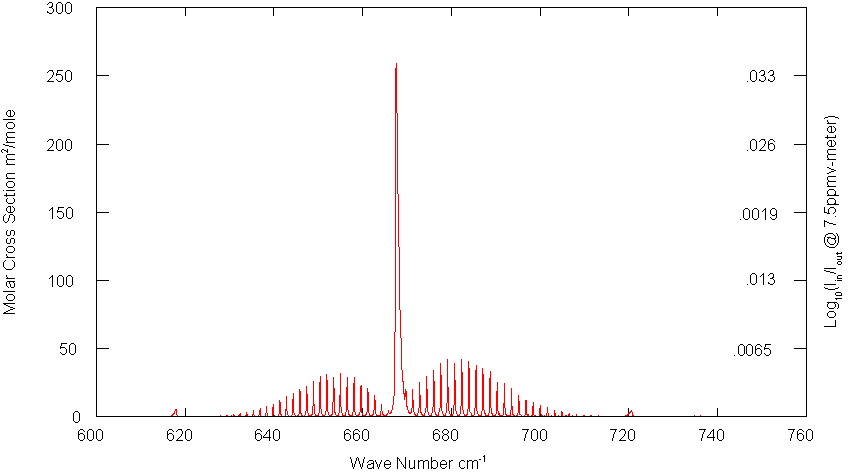
Fig.
1: CO2 Absorption Cross Section
The main
difference is that unlike the EPA files, the table is totally free of
spurious negative absorption values.
To calculate the
average cross section per mole over a range of wave numbers use:
|
|
(8) |
In addition to the main band centered about 665cm-1 there is also a smaller intensity band centered about 1050 cm-1:
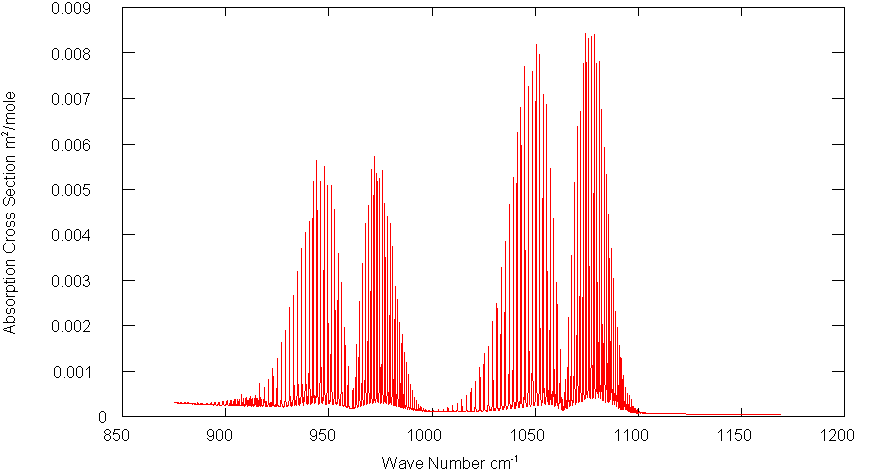
Fig.
2: CO2 1050 cm-1 Absorption Band
The
respective molar cross sections are 5.25 m2/mole
and .0007 m2/mole.
Reference to all this (and more) is contained in the appendix of:
http://www.cfa.harvard.edu/hitran/Download/HITRAN96.pdf
Rothman L.S. THE HITRAN MOLECULAR SPECTROSCOPIC DATABASEAND HAWKS (HITRAN ATMOSPHERIC WORKSTATION)
1996 EDITION
J. Quantitative Spectroscopy and Radiative Transfer Vol. 60, No. 5, pp. 665Ð710, 1998
Also see the FAQ page in the HITRAN web site. where you will find links to the above reference and others.
!      Program Reads HiTran data; calculates a table of absorption cross sections
       PROGRAM CalcXn
       PARAMETER (MAXLINES=100000,NVALUES=5)
       REAL*8 VAL(MAXLINES,NVALUES),DELTAKAPPA,KAPPA,KAPPAHI,KAPPALO,S,V,ILNZ,PI,et
       PARAMETER  (PI=3.1415926535897932385D0)

!      Assign starting and stopping points in the data range.
!      Absorbance values are calculated at interval 2*DELTAKAPPA and
!      start with KAPPA+DELTAKAPPA
!      The output will be in units of cm^2/molecule. Essentially
!      the cross section for absorption over the spectral bandwidth 2*DELTAKAPPA
       KAPPALO=500.; KAPPAHI=750.;       DELTAKAPPA=.0603/2

!      #1: Input file
       OPEN (1,FILE='C:\My Documents\Spectroscopy\HiTranCO2.txt')
       NLINES=1
            DO WHILE(.TRUE.)
!           ia,ib unused
            READ(1,2,END=6) ia,ib,(VAL(NLINES,J),J=1,NVALUES)
2           FORMAT(I2,I1,F12.6,2E10.3,2F5.4)
!           WRITE(6,2)ia,ib,(VAL(NLINES,J),J=1,NVALUES)!optional console writeback
            NLINES=NLINES+1
            END DO
6      CONTINUE
!      #2: output file
       OPEN (2,FILE='C:\My Documents\Spectroscopy\CO2abs.csv')
!      Integrate each line from kappa-deltakappa to kappa+deltakappa
!      Divide the result by 2*deltakappa to get the average intensity.
!      Assign result to the midway value kappa+deltakappa
       et=TIMEF() !Optional timer
       DO 10 KAPPA=KAPPALO+DELTAKAPPA,KAPPAHI+DELTAKAPPA,2*DELTAKAPPA
       S=0.
       DO 20 LINE=1,NLINES
       V=ILNZ(KAPPA+DELTAKAPPA,VAL(LINE,1),VAL(LINE,4))
       V= V-ILNZ(KAPPA-DELTAKAPPA,VAL(LINE,1),VAL(LINE,4))
       S=S+VAL(LINE,2)*V
       20 CONTINUE
       S=S/(2*DELTAKAPPA)
       WRITE(6,'(E16.6,",",E16.6)')KAPPA,S      !optional console output
       WRITE(2,'(E16.6,",",E16.6)')KAPPA,S
       10 CONTINUE
      et=TIMEF() !optional timer
      WRITE(6,*) NLINES ,' Lines',(KAPPAHI-KAPPALO)/2/DELTAKAPPA,&
     &        ' Values', et,' seconds'  !optional stats
      STOP
      END
!     ILNZ returns the indefinite integral of the Lorentz line shape function
      REAL*8 FUNCTION ILNZ(K,K0,G)
      REAL*8 K,K0,G
      ILNZ=DATAN2((K-K0),G)/3.141592658979D0
      END